Overview:
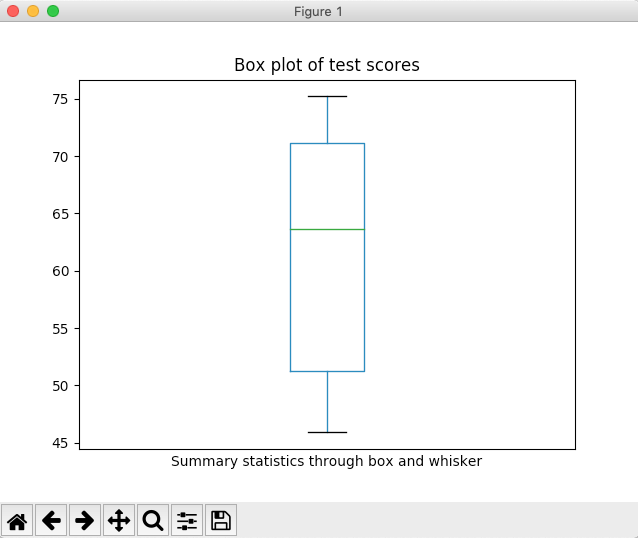
- A box and whisker plot or simply box plot draws a box, using the 25th percentile and 75th percentile of the distribution as its boundaries.
- Median value is marked in the box.
- The box is marked with whiskers that extend up to the minimum value and the maximum value of the distribution.
- Outliers are marked as bubbles.
Drawing a Box plot for the data present in a pandas.Series instance:
- The box() function can be called on the plot member of the Series instance, which plots the box plot for the data.
- In the same way, to draw box plot for a pandas DataFrame the DataFrame.plot.box() function can be used.
Example:
|
# Example Python program to draw a # box-whisker plot for the data present in a pandas Series import pandas as pds import matplotlib.pyplot as plt
# Test scores testScores = [75.2, 45.9, 52, 51, 60, 71, 46.4, 67.2, 74, 71.2];
# Load test scores into a pandas Series series = pds.Series(testScores); series.plot.box(title="Box plot of test scores", xticks=[]);
# Print the summary statistics print(series.describe());
plt.xlabel('Summary statistics through box and whisker'); plt.show(block=True); |
Output:
|
count 10.000000 mean 61.390000 std 11.713093 min 45.900000 25% 51.250000 50% 63.600000 75% 71.150000 max 75.200000 dtype: float64 |
